Scraping metrics from a locked-down broker
This tutorial shows how to deploy a "locked-down" ActiveMQ Artemis broker and securely access its Prometheus metrics endpoint from within the same Kubernetes cluster using mutual TLS (mTLS).
What is mTLS? Mutual TLS means both the client and server authenticate each other using certificates, providing stronger security than regular TLS where only the server is authenticated.
What is a "locked-down" broker? A broker configured with spec.restricted: true that disables anonymous access and requires certificate-based
authentication for all connections.
This tutorial covers setting up a complete secure monitoring pipeline: installing monitoring tools and certificate management, creating a PKI (Public Key Infrastructure - a system for managing certificates), deploying a locked-down broker, configuring secure metrics collection, and visualizing the results with a Grafana dashboard.
Why do this? In production environments, you need to monitor broker performance and health while ensuring all communications are encrypted and authenticated. This prevents unauthorized access to sensitive messaging data and metrics.
A locked-down broker (spec.restricted=true) enhances security by disabling
anonymous access, enabling client certificate authentication, and relying on
cert-manager for certificate lifecycle management.
This tutorial results in a fully secured Apache ActiveMQ Artemis broker with comprehensive monitoring, where all communication uses mutual TLS authentication and real-time messaging metrics are observable through a Grafana dashboard.
Table of Contents
- Architecture Overview
- Understanding the Security Model
- Prerequisites
- Install the dependencies
- Create Certificate Authority and Issuers
- Deploy the Locked-Down Broker
- Scrape the broker
- Deploy and Configure Grafana
- Visit Grafana's dashboard
- Exchange Messages
- Troubleshooting
- Cleanup
- Conclusion
Architecture Overview
Certificate Infrastructure
This diagram shows the PKI hierarchy and how certificates are distributed for mTLS authentication:
Component Interactions
This diagram shows the operational flow between components during normal operation:
Understanding the Security Model
The locked-down broker uses certificate-based authentication. This tutorial uses the following configuration:
-
Certificate-Based Roles: The broker grants access based on certificate Common Names (CN) - the "name" field in a certificate that identifies who it belongs to. We make use of two separate authentication realms, one for messaging and the default one for the control plane.
Messaging Realm (AMQPS acceptor):
- Manually configured in the
artemis-broker-jaas-configsecret - In this tutorial we use
CN=messaging-clientfor messaging permissions (producer/consumer jobs) - You can configure any CN values you need for your application clients
Control Plane Realm (HTTP/Jolokia metrics endpoint):
- Created and configured automatically by the operator in restricted mode
- The operator reads the actual CN values from the certificate secrets and configures access accordingly
- In this tutorial we use:
CN=activemq-artemis-operatorfor operator privileges (management)CN=prometheusfor metrics access (Prometheus scraping)CN=activemq-artemis-operandfor health probes
- You can use different CN values - the operator will extract them from your actual certificates
- Manually configured in the
-
Required Secrets: The following Kubernetes Secrets must exist and contain the appropriate certificates and keys. Default names are shown, but can be customized using environment variables. The operator extracts the CN from each certificate to configure access:
- Broker server certificate - Default:
broker-cert- Server certificate for the broker pod (proves the broker's identity)
- The operator automatically checks for
[cr-name]-broker-certfirst, then falls back tobroker-cert - No environment variable override (uses discovery based on what exists in the namespace)
- CN in this tutorial:
activemq-artemis-operand(used for health probes)
- Operator client certificate - Default:
activemq-artemis-manager-cert- Operator certificate for authenticating with the broker
- Override via env:
ACTIVEMQ_ARTEMIS_MANAGER_CERT_SECRET_NAME - CN in this tutorial:
activemq-artemis-operator(gets operator privileges)
- CA trust bundle - Default:
activemq-artemis-manager-ca- Root certificate that validates all others (key must be
ca.pem) - Override via env:
ACTIVEMQ_ARTEMIS_MANAGER_CA_SECRET_NAME
- Root certificate that validates all others (key must be
- Prometheus client certificate - Default:
prometheus-cert- Prometheus certificate for authenticating to the metrics endpoint
- The operator automatically checks for
[cr-name]-[base-name]first, then falls back to[base-name](where base-name is from env or default) - Override via env:
BASE_PROMETHEUS_CERT_SECRET_NAME(affects both CR-specific and shared secret names) - Example: If env is set to
custom-prometheus, checksmy-broker-custom-prometheusthencustom-prometheus - CN in this tutorial:
prometheus(gets metrics access)
- Broker server certificate - Default:
Prerequisites
Before you start, ensure you have the following tools and resources available:
Required Tools
- kubectl v1.28+ - Kubernetes command-line tool
- helm v3.12+ - Package manager for Kubernetes
- minikube v1.30+ (or alternatives like kind v0.20+, k3s)
- jq - JSON processor (for extracting broker version)
Minimum System Resources
- CPU: 4 cores minimum (for minikube VM + all components)
- RAM: 8GB minimum (minikube will use ~6GB)
- Disk: 20GB free space
Kubernetes Cluster
You need access to a running Kubernetes cluster. A Minikube instance running on your laptop will work for this tutorial.
⚠️ Production Warning: This tutorial uses self-signed certificates suitable for development and testing. For production deployments, integrate with your organization's existing PKI infrastructure and follow your security policies.
Start minikube
minikube start --profile tutorialtester
minikube profile tutorialtester
kubectl config use-context tutorialtester
minikube addons enable metrics-server --profile tutorialtester
* [tutorialtester] minikube v1.36.0 on Fedora 43
  - MINIKUBE_ROOTLESS=true
* Automatically selected the kvm2 driver. Other choices: podman, qemu2, ssh
* Starting "tutorialtester" primary control-plane node in "tutorialtester" cluster
* Creating kvm2 VM (CPUs=2, Memory=6000MB, Disk=20000MB) ...
* Preparing Kubernetes v1.33.1 on Docker 28.0.4 ...
  - Generating certificates and keys ...
  - Booting up control plane ...
  - Configuring RBAC rules ...
* Configuring bridge CNI (Container Networking Interface) ...
* Verifying Kubernetes components...
  - Using image gcr.io/k8s-minikube/storage-provisioner:v5
* Enabled addons: storage-provisioner, default-storageclass
* Done! kubectl is now configured to use "tutorialtester" cluster and "default" namespace by default
! Image was not built for the current minikube version. To resolve this you can delete and recreate your minikube cluster using the latest images. Expected minikube version: v1.35.0 -> Actual minikube version: v1.36.0
* minikube profile was successfully set to tutorialtester
Switched to context "tutorialtester".
* metrics-server is an addon maintained by Kubernetes. For any concerns contact minikube on GitHub.
You can view the list of minikube maintainers at: https://github.com/kubernetes/minikube/blob/master/OWNERS
  - Using image registry.k8s.io/metrics-server/metrics-server:v0.7.2
* The 'metrics-server' addon is enabled
Enable nginx ingress for minikube
Enable SSL passthrough so that the ingress controller forwards encrypted traffic directly to the backend services without terminating TLS at the ingress level. This is required because our broker uses client certificate authentication (mTLS) and needs to handle the TLS handshake itself to validate client certificates.
minikube addons enable ingress
minikube kubectl -- patch deployment -n ingress-nginx ingress-nginx-controller --type='json' -p='[{"op": "add", "path": "/spec/template/spec/containers/0/args/-", "value":"--enable-ssl-passthrough"}]'
* ingress is an addon maintained by Kubernetes. For any concerns contact minikube on GitHub.
You can view the list of minikube maintainers at: https://github.com/kubernetes/minikube/blob/master/OWNERS
  - Using image registry.k8s.io/ingress-nginx/kube-webhook-certgen:v1.5.3
  - Using image registry.k8s.io/ingress-nginx/controller:v1.12.2
  - Using image registry.k8s.io/ingress-nginx/kube-webhook-certgen:v1.5.3
* Verifying ingress addon...
* The 'ingress' addon is enabled
deployment.apps/ingress-nginx-controller patched
Get minikube's IP
This will be used later to construct the Ingress hostname.
export CLUSTER_IP=$(minikube ip --profile tutorialtester)
Create the namespace
All resources for this tutorial will be created in the locked-down-broker namespace.
kubectl create namespace locked-down-broker
kubectl config set-context --current --namespace=locked-down-broker
until kubectl get serviceaccount default -n locked-down-broker &> /dev/null; do sleep 1; done
namespace/locked-down-broker created
Context "tutorialtester" modified.
Deploy the Operator
Go to the root of the operator repo and install it into the locked-down-broker
namespace.
./deploy/install_opr.sh
Deploying operator to watch single namespace
Client Version: 4.18.5
Kustomize Version: v5.4.2
Kubernetes Version: v1.33.1
customresourcedefinition.apiextensions.k8s.io/activemqartemises.broker.amq.io created
customresourcedefinition.apiextensions.k8s.io/activemqartemisaddresses.broker.amq.io created
customresourcedefinition.apiextensions.k8s.io/activemqartemisscaledowns.broker.amq.io created
customresourcedefinition.apiextensions.k8s.io/activemqartemissecurities.broker.amq.io created
serviceaccount/activemq-artemis-controller-manager created
role.rbac.authorization.k8s.io/activemq-artemis-operator-role created
rolebinding.rbac.authorization.k8s.io/activemq-artemis-operator-rolebinding created
role.rbac.authorization.k8s.io/activemq-artemis-leader-election-role created
rolebinding.rbac.authorization.k8s.io/activemq-artemis-leader-election-rolebinding created
deployment.apps/activemq-artemis-controller-manager created
Wait for the Operator to start (status: running).
kubectl wait deployment activemq-artemis-controller-manager --for=create --timeout=240s
kubectl wait pod --all --for=condition=Ready --namespace=locked-down-broker --timeout=600s
deployment.apps/activemq-artemis-controller-manager condition met
pod/activemq-artemis-controller-manager-54fbb4f7df-k2kd9 condition met
Install the dependencies
Install Prometheus Operator
Before setting up the certificate infrastructure, install the Prometheus
Operator. The kube-prometheus-stack includes Prometheus, Grafana, and related
monitoring components.
The Helm flags configure the stack for our tutorial environment:
grafana.sidecar.*: Enables automatic discovery of dashboards and datasources from ConfigMapskube*.enabled=false: Disables some cluster component monitoring (etcd, controller-manager, scheduler)
This installs both a default Prometheus instance (for cluster/pod metrics) and Grafana. We'll create a second custom Prometheus instance specifically for scraping the locked-down broker with mTLS.
helm repo add prometheus-community https://prometheus-community.github.io/helm-charts
helm upgrade -i prometheus prometheus-community/kube-prometheus-stack \
  -n locked-down-broker \
  --set grafana.sidecar.dashboards.namespace=ALL \
  --set grafana.sidecar.dashboards.enabled=true \
  --set grafana.sidecar.datasources.enabled=true \
  --set grafana.sidecar.datasources.label=grafana_datasource \
  --set kubeEtcd.enabled=false \
  --set kubeControllerManager.enabled=false \
  --set kubeScheduler.enabled=false \
  --wait
"prometheus-community" already exists with the same configuration, skipping
Release "prometheus" does not exist. Installing it now.
NAME: prometheus
LAST DEPLOYED: Fri Jan 16 10:16:20 2026
NAMESPACE: locked-down-broker
STATUS: deployed
REVISION: 1
NOTES:
kube-prometheus-stack has been installed. Check its status by running:
  kubectl --namespace locked-down-broker get pods -l "release=prometheus"

Get Grafana 'admin' user password by running:

  kubectl --namespace locked-down-broker get secrets prometheus-grafana -o jsonpath="{.data.admin-password}" | base64 -d ; echo

Access Grafana local instance:

  export POD_NAME=$(kubectl --namespace locked-down-broker get pod -l "app.kubernetes.io/name=grafana,app.kubernetes.io/instance=prometheus" -oname)
  kubectl --namespace locked-down-broker port-forward $POD_NAME 3000

Get your grafana admin user password by running:

  kubectl get secret --namespace locked-down-broker -l app.kubernetes.io/component=admin-secret -o jsonpath="{.items[0].data.admin-password}" | base64 --decode ; echo


Visit https://github.com/prometheus-operator/kube-prometheus for instructions on how to create & configure Alertmanager and Prometheus instances using the Operator.
Install Cert-Manager
kubectl apply -f https://github.com/cert-manager/cert-manager/releases/download/v1.13.2/cert-manager.yaml
namespace/cert-manager created
customresourcedefinition.apiextensions.k8s.io/certificaterequests.cert-manager.io created
customresourcedefinition.apiextensions.k8s.io/certificates.cert-manager.io created
customresourcedefinition.apiextensions.k8s.io/challenges.acme.cert-manager.io created
customresourcedefinition.apiextensions.k8s.io/clusterissuers.cert-manager.io created
customresourcedefinition.apiextensions.k8s.io/issuers.cert-manager.io created
customresourcedefinition.apiextensions.k8s.io/orders.acme.cert-manager.io created
serviceaccount/cert-manager-cainjector created
serviceaccount/cert-manager created
serviceaccount/cert-manager-webhook created
configmap/cert-manager created
configmap/cert-manager-webhook created
clusterrole.rbac.authorization.k8s.io/cert-manager-cainjector created
clusterrole.rbac.authorization.k8s.io/cert-manager-controller-issuers created
clusterrole.rbac.authorization.k8s.io/cert-manager-controller-clusterissuers created
clusterrole.rbac.authorization.k8s.io/cert-manager-controller-certificates created
clusterrole.rbac.authorization.k8s.io/cert-manager-controller-orders created
clusterrole.rbac.authorization.k8s.io/cert-manager-controller-challenges created
clusterrole.rbac.authorization.k8s.io/cert-manager-controller-ingress-shim created
clusterrole.rbac.authorization.k8s.io/cert-manager-cluster-view created
clusterrole.rbac.authorization.k8s.io/cert-manager-view created
clusterrole.rbac.authorization.k8s.io/cert-manager-edit created
clusterrole.rbac.authorization.k8s.io/cert-manager-controller-approve:cert-manager-io created
clusterrole.rbac.authorization.k8s.io/cert-manager-controller-certificatesigningrequests created
clusterrole.rbac.authorization.k8s.io/cert-manager-webhook:subjectaccessreviews created
clusterrolebinding.rbac.authorization.k8s.io/cert-manager-cainjector created
clusterrolebinding.rbac.authorization.k8s.io/cert-manager-controller-issuers created
clusterrolebinding.rbac.authorization.k8s.io/cert-manager-controller-clusterissuers created
clusterrolebinding.rbac.authorization.k8s.io/cert-manager-controller-certificates created
clusterrolebinding.rbac.authorization.k8s.io/cert-manager-controller-orders created
clusterrolebinding.rbac.authorization.k8s.io/cert-manager-controller-challenges created
clusterrolebinding.rbac.authorization.k8s.io/cert-manager-controller-ingress-shim created
clusterrolebinding.rbac.authorization.k8s.io/cert-manager-controller-approve:cert-manager-io created
clusterrolebinding.rbac.authorization.k8s.io/cert-manager-controller-certificatesigningrequests created
clusterrolebinding.rbac.authorization.k8s.io/cert-manager-webhook:subjectaccessreviews created
role.rbac.authorization.k8s.io/cert-manager-cainjector:leaderelection created
role.rbac.authorization.k8s.io/cert-manager:leaderelection created
role.rbac.authorization.k8s.io/cert-manager-webhook:dynamic-serving created
rolebinding.rbac.authorization.k8s.io/cert-manager-cainjector:leaderelection created
rolebinding.rbac.authorization.k8s.io/cert-manager:leaderelection created
rolebinding.rbac.authorization.k8s.io/cert-manager-webhook:dynamic-serving created
service/cert-manager created
service/cert-manager-webhook created
deployment.apps/cert-manager-cainjector created
deployment.apps/cert-manager created
deployment.apps/cert-manager-webhook created
mutatingwebhookconfiguration.admissionregistration.k8s.io/cert-manager-webhook created
validatingwebhookconfiguration.admissionregistration.k8s.io/cert-manager-webhook created
Wait for cert-manager to be ready.
kubectl wait pod --all --for=condition=Ready --namespace=cert-manager --timeout=600s
pod/cert-manager-58f8dcbb68-6wr4t condition met
pod/cert-manager-cainjector-7588b6f5cc-8ghht condition met
pod/cert-manager-webhook-768c67c955-8w5qq condition met
Install Trust Manager
First, add the Jetstack Helm repository.
helm repo add jetstack https://charts.jetstack.io --force-update
"jetstack" has been added to your repositories
Now, install trust-manager. This will be configured to sync trust Bundles to
Secrets in all namespaces.
helm upgrade trust-manager jetstack/trust-manager --install --namespace cert-manager --set secretTargets.enabled=true --set secretTargets.authorizedSecretsAll=true --wait
Release "trust-manager" does not exist. Installing it now.
NAME: trust-manager
LAST DEPLOYED: Fri Jan 16 10:17:28 2026
NAMESPACE: cert-manager
STATUS: deployed
REVISION: 1
TEST SUITE: None
NOTES:
⚠️  WARNING: Consider increasing the Helm value `replicaCount` to 2 if you require high availability.
⚠️  WARNING: Consider setting the Helm value `podDisruptionBudget.enabled` to true if you require high availability.

trust-manager v0.20.3 has been deployed successfully!
Your installation includes a default CA package, using the following
default CA package image:

quay.io/jetstack/trust-pkg-debian-bookworm:20230311-deb12u1.2

It's imperative that you keep the default CA package image up to date.
To find out more about securely running trust-manager and to get started
with creating your first bundle, check out the documentation on the
cert-manager website:

https://cert-manager.io/docs/projects/trust-manager/
Wait for trust bundles crd to be ready.
kubectl wait crd bundles.trust.cert-manager.io --for=create --timeout=240s
kubectl wait pod --all --for=condition=Ready --namespace=cert-manager --timeout=600s
customresourcedefinition.apiextensions.k8s.io/bundles.trust.cert-manager.io condition met
pod/cert-manager-58f8dcbb68-6wr4t condition met
pod/cert-manager-cainjector-7588b6f5cc-8ghht condition met
pod/cert-manager-webhook-768c67c955-8w5qq condition met
pod/trust-manager-86b75967bc-xqvw2 condition met
Create Certificate Authority and Issuers
The locked-down broker relies on cert-manager to issue and manage TLS
certificates. This section sets up a local Certificate Authority (CA) and issuers.
Why cert-manager? Instead of manually creating certificates, cert-manager automates certificate lifecycle management - creating, renewing, and distributing certificates as Kubernetes resources.
Certificate Chain: The process creates a root CA → cluster issuer → individual certificates. This hierarchy allows trusting all certificates by trusting just the root CA.
Create a Root CA
First, create a self-signed ClusterIssuer. This will act as our root
Certificate Authority.
kubectl apply -f - <<EOF
apiVersion: cert-manager.io/v1
kind: ClusterIssuer
metadata:
  name: selfsigned-root-issuer
spec:
  selfSigned: {}
EOF
clusterissuer.cert-manager.io/selfsigned-root-issuer created
Next, create the root certificate itself in the cert-manager namespace.
kubectl apply -f - <<EOF
apiVersion: cert-manager.io/v1
kind: Certificate
metadata:
  name: root-ca
  namespace: cert-manager
spec:
  isCA: true
  commonName: artemis.root.ca
  secretName: root-ca-secret
  issuerRef:
    name: selfsigned-root-issuer
    kind: ClusterIssuer
    group: cert-manager.io
EOF
certificate.cert-manager.io/root-ca created
kubectl wait certificate root-ca -n cert-manager --for=condition=Ready --timeout=300s
certificate.cert-manager.io/root-ca condition met
Create a CA Bundle
Create a trust-manager Bundle. This will read the root CA's secret and
distribute the CA certificate to a new secret in all other namespaces, including
locked-down-broker.
kubectl apply -f - <<EOF
apiVersion: trust.cert-manager.io/v1alpha1
kind: Bundle
metadata:
  name: activemq-artemis-manager-ca
  namespace: cert-manager
spec:
  sources:
  - secret:
      name: root-ca-secret
      key: "tls.crt"
  target:
    secret:
      key: "ca.pem"
EOF
bundle.trust.cert-manager.io/activemq-artemis-manager-ca created
kubectl wait bundle activemq-artemis-manager-ca -n cert-manager --for=condition=Synced --timeout=300s
bundle.trust.cert-manager.io/activemq-artemis-manager-ca condition met
Create a Cluster Issuer
Now, create a ClusterIssuer that will issue certificates signed by our new root CA.
kubectl apply -f - <<EOF
apiVersion: cert-manager.io/v1
kind: ClusterIssuer
metadata:
  name: ca-issuer
spec:
  ca:
    secretName: root-ca-secret
EOF
clusterissuer.cert-manager.io/ca-issuer created
Deploy the Locked-Down Broker
With the certificate infrastructure in place, we can now deploy the broker.
Create Broker and Client Certificates
We need three certificates:
- A server certificate for the broker pod (
broker-cert) - A client certificate for the operator to authenticate with the broker
(
activemq-artemis-manager-cert) - A client certificate for Prometheus to scrape metrics (
prometheus-cert)
kubectl apply -f - <<EOF
---
apiVersion: cert-manager.io/v1
kind: Certificate
metadata:
  name: broker-cert
  namespace: locked-down-broker
spec:
  secretName: broker-cert
  commonName: activemq-artemis-operand
  dnsNames:
    - artemis-broker-ss-0.artemis-broker-hdls-svc.locked-down-broker.svc.cluster.local
    - '*.artemis-broker-hdls-svc.locked-down-broker.svc.cluster.local'
    - artemis-broker-messaging-svc.cluster.local
    - artemis-broker-messaging-svc
  issuerRef:
    name: ca-issuer
    kind: ClusterIssuer
---
apiVersion: cert-manager.io/v1
kind: Certificate
metadata:
  name: activemq-artemis-manager-cert
  namespace: locked-down-broker
spec:
  secretName: activemq-artemis-manager-cert
  commonName: activemq-artemis-operator
  issuerRef:
    name: ca-issuer
    kind: ClusterIssuer
---
apiVersion: cert-manager.io/v1
kind: Certificate
metadata:
  name: prometheus-cert
  namespace: locked-down-broker
spec:
  secretName: prometheus-cert
  commonName: prometheus
  issuerRef:
    name: ca-issuer
    kind: ClusterIssuer
EOF
certificate.cert-manager.io/broker-cert created
certificate.cert-manager.io/activemq-artemis-manager-cert created
certificate.cert-manager.io/prometheus-cert created
Wait for the secrets to be created.
kubectl wait --for=condition=Ready certificate broker-cert -n locked-down-broker --timeout=300s
kubectl wait --for=condition=Ready certificate activemq-artemis-manager-cert -n locked-down-broker --timeout=300s
kubectl wait --for=condition=Ready certificate prometheus-cert -n locked-down-broker --timeout=300s
certificate.cert-manager.io/broker-cert condition met
certificate.cert-manager.io/activemq-artemis-manager-cert condition met
certificate.cert-manager.io/prometheus-cert condition met
Deploy the Broker Custom Resource
export BROKER_FQDN=artemis-broker-ss-0.artemis-broker-hdls-svc.locked-down-broker.svc.cluster.local
About the FQDN: This Fully Qualified Domain Name follows Kubernetes' naming
pattern: <pod-name>.<service-name>.<namespace>.svc.cluster.local. The broker's
certificate must include this exact name so clients can verify they're
connecting to the right broker.
Create a PEMCFG file that tells the broker where to find its TLS certificate and key. PEMCFG is a simple format that points to PEM certificate files, allowing the broker to serve secure connections without requiring JKS keystores.
kubectl apply -f - <<EOF
apiVersion: v1
kind: Secret
metadata:
  name: amqps-pem
  namespace: locked-down-broker
type: Opaque
stringData:
  _amqps.pemcfg: |
    source.key=/amq/extra/secrets/broker-cert/tls.key
    source.cert=/amq/extra/secrets/broker-cert/tls.crt
EOF
secret/amqps-pem created
Create a broker properties secret for the JAAS configuration. The broker reads
additional broker properties from secrets ending in -bp, but the secret still
must be listed under deploymentPlan.extraMounts.secrets so the operator mounts
it.
kubectl apply -f - <<'EOF'
apiVersion: v1
kind: Secret
metadata:
  name: artemis-broker-jaas-config-bp
  namespace: locked-down-broker
stringData:
  cert-users: "messaging-client=/.*messaging-client.*/"
  cert-roles: "messaging=messaging-client"
  jaas-config-bp.properties: |
    jaasConfigs."activemq".modules.cert.loginModuleClass=org.apache.activemq.artemis.spi.core.security.jaas.TextFileCertificateLoginModule
    jaasConfigs."activemq".modules.cert.controlFlag=required
    jaasConfigs."activemq".modules.cert.params.debug=true
    jaasConfigs."activemq".modules.cert.params."org.apache.activemq.jaas.textfiledn.role"=cert-roles
    jaasConfigs."activemq".modules.cert.params."org.apache.activemq.jaas.textfiledn.user"=cert-users
    jaasConfigs."activemq".modules.cert.params.baseDir=/amq/extra/secrets/artemis-broker-jaas-config-bp
EOF
secret/artemis-broker-jaas-config-bp created
Now, deploy the ActiveMQArtemis custom resource with spec.restricted: true,
along with the configuration for the acceptor.
Key Configuration Elements:
restricted: true: Enables certificate-based authentication mode and automatic control plane authenticationbrokerProperties: Configure messaging queues, security roles, and network acceptorsextraMounts.secrets: Mount certificate and configuration files into the broker pod
For detailed explanation of broker properties, see the broker configuration documentation.
kubectl apply -f - <<'EOF'
apiVersion: broker.amq.io/v1beta1
kind: ActiveMQArtemis
metadata:
  name: artemis-broker
  namespace: locked-down-broker
spec:
  restricted: true
  brokerProperties:
    - "messageCounterSamplePeriod=500"
    # Create a queue for messaging
    - "addressConfigurations.APP_JOBS.routingTypes=ANYCAST"
    - "addressConfigurations.APP_JOBS.queueConfigs.APP_JOBS.routingType=ANYCAST"
    # Define a new 'messaging' role with permissions for the APP.JOBS address
    - "securityRoles.APP_JOBS.messaging.browse=true"
    - "securityRoles.APP_JOBS.messaging.consume=true"
    - "securityRoles.APP_JOBS.messaging.send=true"
    - "securityRoles.APP_JOBS.messaging.view=true"
    # AMQPS acceptor using broker properties
    - "acceptorConfigurations.\"amqps\".factoryClassName=org.apache.activemq.artemis.core.remoting.impl.netty.NettyAcceptorFactory"
    - "acceptorConfigurations.\"amqps\".params.host=${HOSTNAME}"
    - "acceptorConfigurations.\"amqps\".params.port=61617"
    - "acceptorConfigurations.\"amqps\".params.protocols=amqp"
    - "acceptorConfigurations.\"amqps\".params.securityDomain=activemq"
    - "acceptorConfigurations.\"amqps\".params.sslEnabled=true"
    - "acceptorConfigurations.\"amqps\".params.needClientAuth=true"
    - "acceptorConfigurations.\"amqps\".params.saslMechanisms=EXTERNAL"
    - "acceptorConfigurations.\"amqps\".params.keyStoreType=PEMCFG"
    - "acceptorConfigurations.\"amqps\".params.keyStorePath=/amq/extra/secrets/amqps-pem/_amqps.pemcfg"
    - "acceptorConfigurations.\"amqps\".params.trustStoreType=PEMCA"
    - "acceptorConfigurations.\"amqps\".params.trustStorePath=/amq/extra/secrets/activemq-artemis-manager-ca/ca.pem"
  deploymentPlan:
    image: quay.io/arkmq-org/activemq-artemis-broker-kubernetes:snapshot
    extraMounts:
      secrets: [artemis-broker-jaas-config-bp, amqps-pem]
EOF
activemqartemis.broker.amq.io/artemis-broker created
Wait for the broker to be ready.
kubectl wait ActiveMQArtemis artemis-broker --for=condition=Ready --namespace=locked-down-broker --timeout=300s
activemqartemis.broker.amq.io/artemis-broker condition met
Scrape the broker
Configure and Deploy Prometheus
With the broker running, the next step is to configure Prometheus to scrape its
metrics endpoint. This section uses the Prometheus Operator installed earlier to
manage a Prometheus instance. The instance is configured via a
ServiceMonitor to securely scrape the broker's metrics endpoint using the mTLS
certificates created in the Broker and Client
Certificates section.
Create the ServiceMonitor and Prometheus Instance
ServiceMonitor is a Kubernetes custom resource that tells the Prometheus Operator how to scrape metrics from services. It defines the scraping configuration including:
- Which service to scrape (using label selectors)
- How to connect securely (HTTPS with mTLS certificates)
- Authentication details (which certificates to use)
Prometheus Resource tells the Prometheus Operator to deploy a Prometheus server that will:
- Automatically discover ServiceMonitors with matching labels
- Use the specified service account for Kubernetes API access
- Store and query the collected metrics
Using the Prometheus Operator simplifies deployment by managing the complex Prometheus configuration automatically.
First, create the ServiceMonitor that tells Prometheus how to scrape the
broker's metrics endpoint with mTLS authentication using the dedicated
Prometheus certificate:
kubectl apply -f - <<EOF
apiVersion: monitoring.coreos.com/v1
kind: ServiceMonitor
metadata:
  name: artemis-broker-monitor
  namespace: locked-down-broker
  labels:
    # This label is used by the Prometheus resource to discover this monitor.
    app: artemis-broker
spec:
  selector:
    matchLabels:
      # This label must match the label on your Artemis broker's Service.
      app: artemis-broker
  endpoints:
  - port: metrics # This must match the name of the port in the Service.
    scheme: https
    tlsConfig:
      # The server name for certificate validation.
      serverName: '${BROKER_FQDN}'
      # CA certificate to trust the broker's server certificate.
      ca:
        secret:
          name: activemq-artemis-manager-ca
          key: ca.pem
      # Client certificate and key for mutual TLS authentication.
      # This uses the dedicated Prometheus certificate (CN: prometheus).
      cert:
        secret:
          name: prometheus-cert
          key: tls.crt
      keySecret:
        name: prometheus-cert
        key: tls.key
EOF
servicemonitor.monitoring.coreos.com/artemis-broker-monitor created
Next, create a Service to expose the broker's metrics port, a Prometheus
resource to deploy the Prometheus server, and a dedicated service for this
Prometheus instance:
kubectl apply -f - <<EOF
apiVersion: v1
kind: Service
metadata:
  name: artemis-broker-metrics
  namespace: locked-down-broker
  labels:
    app: artemis-broker
spec:
  selector:
    # This must match the labels on the broker pod.
    ActiveMQArtemis: artemis-broker
  ports:
    - name: metrics
      port: 8888
      targetPort: 8888
      protocol: TCP
---
apiVersion: monitoring.coreos.com/v1
kind: Prometheus
metadata:
  name: artemis-prometheus
  namespace: locked-down-broker
spec:
  # The Prometheus Operator will create a StatefulSet with this many replicas.
  replicas: 1
  # The ServiceAccount used by Prometheus pods for service discovery.
  # Note: The name depends on the Helm release name. With a release name of prometheus, this becomes prometheus-prometheus.
  serviceAccountName: prometheus-kube-prometheus-prometheus
  # Specifies the Prometheus container image version.
  version: v2.53.0
  # Tells this Prometheus instance to use ServiceMonitors that have this label.
  serviceMonitorSelector:
    matchLabels:
      app: artemis-broker
  serviceMonitorNamespaceSelector: {}
---
apiVersion: v1
kind: Service
metadata:
  name: artemis-prometheus-svc
  namespace: locked-down-broker
spec:
  selector:
    # This specifically selects only our custom Prometheus instance
    prometheus: artemis-prometheus
  ports:
    - name: web
      port: 9090
      targetPort: 9090
      protocol: TCP
EOF
service/artemis-broker-metrics created
prometheus.monitoring.coreos.com/artemis-prometheus created
service/artemis-prometheus-svc created
Finally, create a ClusterRoleBinding to grant the Prometheus ServiceAccount
the necessary permissions to scrape metrics:
kubectl apply -f - <<EOF
apiVersion: rbac.authorization.k8s.io/v1
kind: ClusterRoleBinding
metadata:
  name: prometheus-cluster-role-binding
subjects:
- kind: ServiceAccount
  name: prometheus-kube-prometheus-prometheus
  namespace: locked-down-broker
roleRef:
  kind: ClusterRole
  name: prometheus-kube-prometheus-prometheus
  apiGroup: rbac.authorization.k8s.io
EOF
clusterrolebinding.rbac.authorization.k8s.io/prometheus-cluster-role-binding created
Wait for the Prometheus pod to be ready.
sleep 5
kubectl rollout status statefulset/prometheus-artemis-prometheus -n locked-down-broker --timeout=300s
Waiting for 1 pods to be ready...
statefulset rolling update complete 1 pods at revision prometheus-artemis-prometheus-765678bf49...
Deploy and Configure Grafana
With both Prometheus instances running (the default one for cluster metrics and our custom one scraping the broker), the final step is to visualize the data in Grafana.
We'll configure Grafana to use both Prometheus instances:
- Default Prometheus: For cluster/pod metrics (CPU, Memory)
- Custom Artemis-Prometheus: For broker-specific metrics (messages, throughput)
This allows us to create comprehensive dashboards showing both infrastructure and application metrics.
Configure Grafana Datasources
We need to configure the custom Artemis-Prometheus as a datasource in Grafana. The default Prometheus datasource already exists from kube-prometheus-stack.
Why a dedicated service? Without a artemis-prometheus-svc that
specifically selects only our custom Prometheus instance, the generic
prometheus-operated service would load-balance between both Prometheus
instances, causing panels to randomly show data from the wrong source.
First, let's verify the default Prometheus service name and port:
echo "Checking Prometheus services..."
kubectl get svc -n locked-down-broker -l app.kubernetes.io/name=prometheus
echo ""
echo "Default Prometheus service details:"
kubectl get svc -n locked-down-broker prometheus-kube-prometheus-prometheus -o jsonpath='{.metadata.name}:{.spec.ports[0].port}{"\n"}'
Checking Prometheus services...

Default Prometheus service details:
prometheus-kube-prometheus-prometheus:9090
No resources found in locked-down-broker namespace.
Now create a ConfigMap defining the Artemis datasource with a fixed UID. We
only need to define this one explicitly since the default Prometheus datasource
already exists from kube-prometheus-stack. The key difference is the URL - we
point to artemis-prometheus-svc which is a dedicated service that selects only
our custom Prometheus instance (not the default one):
kubectl apply -f - <<EOF
apiVersion: v1
kind: ConfigMap
metadata:
  name: grafana-datasource-artemis
  namespace: locked-down-broker
  labels:
    grafana_datasource: "1"
data:
  datasource.yaml: |
    apiVersion: 1
    datasources:
    - name: Artemis-Prometheus
      type: prometheus
      access: proxy
      url: http://artemis-prometheus-svc:9090
      isDefault: false
      editable: false
      uid: artemis-prometheus
      jsonData:
        timeInterval: 30s
EOF
configmap/grafana-datasource-artemis created
The Grafana sidecar will automatically detect this ConfigMap and configure the datasource within a few seconds. To ensure clean configuration, restart Grafana:
kubectl rollout restart deployment prometheus-grafana -n locked-down-broker
kubectl rollout status deployment prometheus-grafana -n locked-down-broker --timeout=300s
deployment.apps/prometheus-grafana restarted
Waiting for deployment spec update to be observed...
Waiting for deployment "prometheus-grafana" rollout to finish: 0 out of 1 new replicas have been updated...
Waiting for deployment "prometheus-grafana" rollout to finish: 1 old replicas are pending termination...
Waiting for deployment "prometheus-grafana" rollout to finish: 1 old replicas are pending termination...
deployment "prometheus-grafana" successfully rolled out
Wait a moment and verify both Prometheus instances and datasources:
echo "Testing Prometheus and Grafana datasource configuration..."
echo ""

# Test 1: Artemis-Prometheus connectivity
echo "✓ Test 1: Artemis-Prometheus is reachable"
ARTEMIS_PROM_STATUS=$(kubectl run test-artemis-prom --rm -i --restart=Never --image=curlimages/curl:latest -n locked-down-broker -- \
  curl -s http://artemis-prometheus-svc:9090/api/v1/query?query=up --max-time 5 2>/dev/null | grep -o '"status":"success"' || echo "")
if [ -z "$ARTEMIS_PROM_STATUS" ]; then
  echo "  ✗ FAILED: Cannot connect to artemis-prometheus-svc:9090"
  exit 1
fi
echo "  artemis-prometheus-svc:9090 is responding"

# Test 2: Cluster-Prometheus connectivity
echo "✓ Test 2: Cluster-Prometheus is reachable"
CLUSTER_PROM_STATUS=$(kubectl run test-cluster-prom --rm -i --restart=Never --image=curlimages/curl:latest -n locked-down-broker -- \
  curl -s http://prometheus-kube-prometheus-prometheus:9090/api/v1/query?query=up --max-time 5 2>/dev/null | grep -o '"status":"success"' || echo "")
if [ -z "$CLUSTER_PROM_STATUS" ]; then
  echo "  ✗ FAILED: Cannot connect to prometheus-kube-prometheus-prometheus:9090"
  exit 1
fi
echo "  prometheus-kube-prometheus-prometheus:9090 is responding"

# Test 3: Broker metrics availability
echo "✓ Test 3: Broker metrics are available in Artemis-Prometheus"
BROKER_METRICS=$(kubectl run test-broker-metrics --rm -i --restart=Never --image=curlimages/curl:latest -n locked-down-broker -- \
  curl -s 'http://artemis-prometheus-svc:9090/api/v1/query?query=artemis_total_pending_message_count' --max-time 5 2>/dev/null | grep -o '"status":"success"' || echo "")
if [ -z "$BROKER_METRICS" ]; then
  echo "  ✗ FAILED: Broker metrics not found in Artemis-Prometheus"
  exit 1
fi
echo "  artemis_total_pending_message_count is queryable"

# Test 4: CPU/Memory metrics availability
echo "✓ Test 4: Infrastructure metrics are available in Cluster-Prometheus"
CPU_METRICS=$(kubectl run test-cpu-metrics --rm -i --restart=Never --image=curlimages/curl:latest -n locked-down-broker -- \
  curl -s 'http://prometheus-kube-prometheus-prometheus:9090/api/v1/query?query=container_cpu_usage_seconds_total' --max-time 5 2>/dev/null | grep -o '"status":"success"' || echo "")
if [ -z "$CPU_METRICS" ]; then
  echo "  ✗ FAILED: CPU metrics not found in Cluster-Prometheus"
  exit 1
fi
echo "  container_cpu_usage_seconds_total is queryable"

# Test 5: Grafana datasources
echo "✓ Test 5: Grafana has both datasources configured"

# Get the Grafana admin password from the secret
export GRAFANA_PASSWORD=$(kubectl get secret -n locked-down-broker prometheus-grafana -o jsonpath="{.data.admin-password}" | base64 --decode)

# Wait for Grafana API to be ready with proper authentication
echo "  Waiting for Grafana to be fully initialized..."
DATASOURCES=$(kubectl exec -n locked-down-broker deployment/prometheus-grafana -- \
  curl -s --retry 36 --retry-delay 5 --retry-all-errors \
    http://localhost:3000/api/datasources -u admin:${GRAFANA_PASSWORD})

# Validate the response is a valid JSON array
if ! echo "$DATASOURCES" | jq -e 'type == "array"' >/dev/null 2>&1; then
  echo "  ✗ FAILED: Grafana returned invalid response"
  echo "  Response: $DATASOURCES"
  exit 1
fi
echo "  Grafana is ready and authenticated"

ARTEMIS_DS=$(echo "$DATASOURCES" | jq -r '.[] | select(.uid=="artemis-prometheus") | .name')
if [ "$ARTEMIS_DS" != "Artemis-Prometheus" ]; then
  echo "  ✗ FAILED: Artemis-Prometheus datasource not found or has wrong name"
  exit 1
fi
echo "  Found: Artemis-Prometheus (uid: artemis-prometheus)"

CLUSTER_DS=$(echo "$DATASOURCES" | jq -r '.[] | select(.uid=="prometheus") | .name')
if [ "$CLUSTER_DS" != "Prometheus" ]; then
  echo "  ✗ FAILED: Prometheus datasource not found or has wrong name"
  exit 1
fi
echo "  Found: Prometheus (uid: prometheus)"
Testing Prometheus and Grafana datasource configuration...

✓ Test 1: Artemis-Prometheus is reachable
  artemis-prometheus-svc:9090 is responding
✓ Test 2: Cluster-Prometheus is reachable
  prometheus-kube-prometheus-prometheus:9090 is responding
✓ Test 3: Broker metrics are available in Artemis-Prometheus
  artemis_total_pending_message_count is queryable
✓ Test 4: Infrastructure metrics are available in Cluster-Prometheus
  container_cpu_usage_seconds_total is queryable
✓ Test 5: Grafana has both datasources configured
  Waiting for Grafana to be fully initialized...
  Grafana is ready and authenticated
  Found: Artemis-Prometheus (uid: artemis-prometheus)
  Found: Prometheus (uid: prometheus)
Now Grafana has two Prometheus datasources with explicit, stable UIDs:
- Prometheus (UID:
prometheus, default from kube-prometheus-stack): For cluster/pod metrics (CPU, Memory)- URL:
http://prometheus-kube-prometheus-prometheus:9090
- URL:
- Artemis-Prometheus (UID:
artemis-prometheus, our custom one): For broker-specific metrics- URL:
http://artemis-prometheus-svc:9090(dedicated service to avoid load-balancing)
- URL:
Key Configuration Details:
- The Artemis datasource URL points to
artemis-prometheus-svc, which uses a specific selector (prometheus: artemis-prometheus) to route traffic only to our custom Prometheus instance - Dashboard panels reference datasource UIDs at both the panel level AND in each target query to ensure Grafana uses the correct datasource
- Setting
editable: falseprevents accidental datasource modifications that could cause issues
Create the Grafana Dashboard
Create a ConfigMap containing the JSON definition for our dashboard. The
Grafana instance is configured to automatically discover any ConfigMaps with
the label grafana_dashboard: "1".
kubectl apply -f - <<EOF
---
apiVersion: v1
kind: ConfigMap
metadata:
  name: artemis-dashboard
  namespace: locked-down-broker
  labels:
    grafana_dashboard: "1"
data:
  artemis-dashboard.json: |
    {
      "__inputs": [],
      "__requires": [],
      "annotations": { "list": [] },
      "editable": true,
      "gnetId": null,
      "graphTooltip": 0,
      "id": 1,
      "links": [],
      "panels": [
        {
          "gridPos": { "h": 8, "w": 12, "x": 0, "y": 0 },
          "title": "Pending Messages",
          "type": "timeseries",
          "datasource": { "type": "prometheus", "uid": "artemis-prometheus" },
          "targets": [{
            "datasource": { "type": "prometheus", "uid": "artemis-prometheus" },
            "expr": "artemis_total_pending_message_count{pod=\"artemis-broker-ss-0\"}",
            "refId": "A"
          }]
        },
        {
          "gridPos": { "h": 8, "w": 12, "x": 12, "y": 0 },
          "title": "Total Produced",
          "type": "timeseries",
          "datasource": { "type": "prometheus", "uid": "artemis-prometheus" },
          "targets": [{
            "datasource": { "type": "prometheus", "uid": "artemis-prometheus" },
            "expr": "artemis_total_produced_message_count_total{pod=\"artemis-broker-ss-0\"}",
            "refId": "A"
          }]
        },
        {
          "gridPos": { "h": 8, "w": 12, "x": 0, "y": 8 },
          "title": "Total Consumed",
          "type": "timeseries",
          "datasource": { "type": "prometheus", "uid": "artemis-prometheus" },
          "targets": [{
            "datasource": { "type": "prometheus", "uid": "artemis-prometheus" },
            "expr": "artemis_total_consumed_message_count_total{pod=\"artemis-broker-ss-0\"}",
            "refId": "A"
          }]
        },
        {
          "gridPos": { "h": 8, "w": 12, "x": 12, "y": 8 },
          "title": "Throughput (messages per second)",
          "type": "timeseries",
          "datasource": { "type": "prometheus", "uid": "artemis-prometheus" },
          "targets": [
            {
              "datasource": { "type": "prometheus", "uid": "artemis-prometheus" },
              "expr": "rate(artemis_total_produced_message_count_total{pod=\"artemis-broker-ss-0\"}[1m])",
              "refId": "A",
              "legendFormat": "Produced"
            },
            {
              "datasource": { "type": "prometheus", "uid": "artemis-prometheus" },
              "expr": "rate(artemis_total_consumed_message_count_total{pod=\"artemis-broker-ss-0\"}[1m])",
              "refId": "B",
              "legendFormat": "Consumed"
            }
          ]
        },
        {
          "gridPos": { "h": 8, "w": 12, "x": 0, "y": 16 },
          "title": "CPU Usage",
          "type": "timeseries",
          "datasource": { "type": "prometheus", "uid": "prometheus" },
          "targets": [{
            "datasource": { "type": "prometheus", "uid": "prometheus" },
            "expr": "sum(rate(container_cpu_usage_seconds_total{pod=\"artemis-broker-ss-0\"}[5m])) by (pod)",
            "refId": "A",
            "legendFormat": "CPU Usage"
          }]
        },
        {
          "gridPos": { "h": 8, "w": 12, "x": 12, "y": 16 },
          "title": "Memory Usage",
          "type": "timeseries",
          "datasource": { "type": "prometheus", "uid": "prometheus" },
          "targets": [{
            "datasource": { "type": "prometheus", "uid": "prometheus" },
            "expr": "sum(container_memory_working_set_bytes{pod=\"artemis-broker-ss-0\"}) by (pod)",
            "refId": "A",
            "legendFormat": "Memory Usage"
          }]
        }
      ],
      "refresh": "1s",
      "schemaVersion": 36,
      "style": "dark",
      "tags": [],
      "templating": { "list": [] },
      "time": { "from": "now-5m", "to": "now" },
      "timepicker": {},
      "timezone": "",
      "title": "Artemis Broker Metrics",
      "uid": "artemis-broker-dashboard"
    }
EOF
configmap/artemis-dashboard created
Restart Grafana one final time to ensure the dashboard is loaded with fresh datasource connections:
kubectl wait configMap artemis-dashboard --for=create --namespace=locked-down-broker --timeout=600s
kubectl rollout restart deployment prometheus-grafana -n locked-down-broker
kubectl rollout status deployment prometheus-grafana -n locked-down-broker --timeout=300s
echo ""
echo "Grafana is ready. Waiting for sidecar to load dashboard..."
sleep 15
configmap/artemis-dashboard condition met
deployment.apps/prometheus-grafana restarted
Waiting for deployment "prometheus-grafana" rollout to finish: 0 out of 1 new replicas have been updated...
Waiting for deployment "prometheus-grafana" rollout to finish: 1 old replicas are pending termination...
Waiting for deployment "prometheus-grafana" rollout to finish: 1 old replicas are pending termination...
deployment "prometheus-grafana" successfully rolled out

Grafana is ready. Waiting for sidecar to load dashboard...
Verify that the dashboard has been loaded correctly and has the expected configuration:
echo "Testing Artemis Broker Metrics dashboard configuration..."
echo ""

# Get the Grafana admin password from the secret
GRAFANA_PASSWORD=$(kubectl get secret -n locked-down-broker prometheus-grafana -o jsonpath="{.data.admin-password}" | base64 --decode)

until FOUND=$(kubectl exec -n locked-down-broker deployment/prometheus-grafana -- \
  curl -s 'http://localhost:3000/api/search?query=*artemis*' -u admin:${GRAFANA_PASSWORD}) && [[ $FOUND != '[]' ]]; do echo "dashboard not found... try again in 5" && sleep 5; done

# Fetch dashboard JSON once
DASHBOARD_JSON=$(kubectl exec -n locked-down-broker deployment/prometheus-grafana -- \
  curl -s 'http://localhost:3000/api/dashboards/uid/artemis-broker-dashboard' -u admin:${GRAFANA_PASSWORD})

# Test 1: Check dashboard exists and has correct title
echo "✓ Test 1: Dashboard exists with correct title"
TITLE=$(echo "$DASHBOARD_JSON" | jq -r '.dashboard.title')
if [ "$TITLE" != "Artemis Broker Metrics" ]; then
  echo "  ✗ FAILED: Expected 'Artemis Broker Metrics', got '$TITLE'"
  exit 1
fi
echo "  Title: $TITLE"

# Test 2: Check panel count
echo "✓ Test 2: Dashboard has exactly 6 panels"
PANEL_COUNT=$(echo "$DASHBOARD_JSON" | jq -r '.dashboard.panels | length')
if [ "$PANEL_COUNT" != "6" ]; then
  echo "  ✗ FAILED: Expected 6 panels, got $PANEL_COUNT"
  exit 1
fi
echo "  Panel count: $PANEL_COUNT"

# Test 3: Check broker metrics panels use artemis-prometheus
echo "✓ Test 3: Broker metrics panels use artemis-prometheus datasource"
for i in 0 1 2 3; do
  PANEL_TITLE=$(echo "$DASHBOARD_JSON" | jq -r ".dashboard.panels[$i].title")
  DATASOURCE=$(echo "$DASHBOARD_JSON" | jq -r ".dashboard.panels[$i].datasource.uid")
  if [ "$DATASOURCE" != "artemis-prometheus" ]; then
    echo "  ✗ FAILED: Panel '$PANEL_TITLE' uses '$DATASOURCE' instead of 'artemis-prometheus'"
    exit 1
  fi
  echo "  $PANEL_TITLE → $DATASOURCE"
done

# Test 4: Check infrastructure metrics panels use prometheus
echo "✓ Test 4: Infrastructure metrics panels use prometheus datasource"
for i in 4 5; do
  PANEL_TITLE=$(echo "$DASHBOARD_JSON" | jq -r ".dashboard.panels[$i].title")
  DATASOURCE=$(echo "$DASHBOARD_JSON" | jq -r ".dashboard.panels[$i].datasource.uid")
  if [ "$DATASOURCE" != "prometheus" ]; then
    echo "  ✗ FAILED: Panel '$PANEL_TITLE' uses '$DATASOURCE' instead of 'prometheus'"
    exit 1
  fi
  echo "  $PANEL_TITLE → $DATASOURCE"
done
Testing Artemis Broker Metrics dashboard configuration...

✓ Test 1: Dashboard exists with correct title
  Title: Artemis Broker Metrics
✓ Test 2: Dashboard has exactly 6 panels
  Panel count: 6
✓ Test 3: Broker metrics panels use artemis-prometheus datasource
  Pending Messages → artemis-prometheus
  Total Produced → artemis-prometheus
  Total Consumed → artemis-prometheus
  Throughput (messages per second) → artemis-prometheus
✓ Test 4: Infrastructure metrics panels use prometheus datasource
  CPU Usage → prometheus
  Memory Usage → prometheus
Expose Grafana with an Ingress
Create an Ingress resource to expose the prometheus-grafana service to the
outside of the cluster.
export GRAFANA_HOST=grafana.locked-down-broker.${CLUSTER_IP}.nip.io
kubectl apply -f - <<EOF
apiVersion: networking.k8s.io/v1
kind: Ingress
metadata:
  name: grafana-ingress
  namespace: locked-down-broker
spec:
  ingressClassName: nginx
  rules:
  - host: ${GRAFANA_HOST}
    http:
      paths:
      - path: /
        pathType: Prefix
        backend:
          service:
            name: prometheus-grafana
            port:
              number: 80
EOF
ingress.networking.k8s.io/grafana-ingress created
Visit Grafana's dashboard
Before accessing the UI, we can send a request to Grafana's health check API endpoint to confirm it's running correctly.
# It can take a moment for the Ingress to be fully provisioned, so we wait for it to get an IP address.
until curl -s "http://${GRAFANA_HOST}/api/health" --max-time 3 | grep database.*ok &> /dev/null; do echo "Waiting for Grafana Ingress"  && sleep 2; done
A successful response will include "database":"ok", confirming that Grafana is
up and connected to its database.
Now, open your web browser and navigate to http://${GRAFANA_HOST}.
Log in with the default credentials:
- Username:
admin - Password:
prom-operator
You will be prompted to change your password. Once logged in:
- Navigate to Dashboards → Browse to find the "Artemis Broker Metrics" dashboard
- Open the dashboard
Exchange Messages
With the monitoring infrastructure in place, generate some metrics by sending and receiving messages.
Create a Client Certificate
First, create a dedicated certificate for the messaging client. This client will
authenticate with the Common Name messaging-client, which matches the
configuration in the JAAS login.config file.
kubectl apply -f - <<EOF
apiVersion: cert-manager.io/v1
kind: Certificate
metadata:
  name: messaging-client-cert
  namespace: locked-down-broker
spec:
  secretName: messaging-client-cert
  commonName: messaging-client
  issuerRef:
    name: ca-issuer
    kind: ClusterIssuer
EOF
certificate.cert-manager.io/messaging-client-cert created
kubectl wait certificate messaging-client-cert -n locked-down-broker --for=condition=Ready --timeout=300s
certificate.cert-manager.io/messaging-client-cert condition met
Create Client Keystore Configuration
The messaging clients need configuration to use PEM certificates instead of Java keystores.
The tls.pemcfg file points to the certificate files, and the Java security property
enables the PEM keystore provider.
kubectl apply -f - <<EOF
apiVersion: v1
kind: Secret
metadata:
  name: cert-pemcfg
  namespace: locked-down-broker
type: Opaque
stringData:
  tls.pemcfg: |
    source.key=/app/tls/client/tls.key
    source.cert=/app/tls/client/tls.crt
  java.security: security.provider.6=de.dentrassi.crypto.pem.PemKeyStoreProvider
EOF
secret/cert-pemcfg created
Expose the Messaging Acceptor
Create a Kubernetes Service to expose the broker's AMQPS acceptor port (61617).
kubectl apply -f - <<EOF
apiVersion: v1
kind: Service
metadata:
  name: artemis-broker-messaging-svc
  namespace: locked-down-broker
spec:
  selector:
    ActiveMQArtemis: artemis-broker
  ports:
  - name: amqps
    port: 61617
    targetPort: 61617
    protocol: TCP
EOF
service/artemis-broker-messaging-svc created
Run Producer and Consumer Jobs
Now, run two Kubernetes Jobs. One will produce 1000 messages to the APP.JOBS
queue, and the other will consume them. They are configured to use the
messaging-client-cert to authenticate.
Note that the image version used by the jobs should match the one deployed by
the operator. We can get it from the ActiveMQArtemis CR status.
export BROKER_VERSION=$(kubectl get ActiveMQArtemis artemis-broker --namespace=locked-down-broker -o json | jq .status.version.brokerVersion -r)
echo broker version: $BROKER_VERSION
broker version: 2.44.0
# wait a bit that grafana is loaded and has started scraping data before sending messages
sleep 60
cat <<'EOT' > deploy.yml
---
apiVersion: batch/v1
kind: Job
metadata:
  name: producer
  namespace: locked-down-broker
spec:
  template:
    spec:
      containers:
      - name: producer
EOT
cat <<EOT >> deploy.yml
        image: quay.io/arkmq-org/activemq-artemis-broker-kubernetes:artemis.${BROKER_VERSION}
EOT
cat <<'EOT' >> deploy.yml
        command:
        - "/bin/sh"
        - "-c"
        - exec java -classpath /opt/amq/lib/*:/opt/amq/lib/extra/* org.apache.activemq.artemis.cli.Artemis producer --protocol=AMQP --url 'amqps://artemis-broker-messaging-svc:61617?transport.trustStoreType=PEMCA&transport.trustStoreLocation=/app/tls/ca/ca.pem&transport.keyStoreType=PEMCFG&transport.keyStoreLocation=/app/tls/pem/tls.pemcfg' --message-count 10000 --destination queue://APP_JOBS;
        env:
        - name: JDK_JAVA_OPTIONS
          value: "-Djava.security.properties=/app/tls/pem/java.security"
        volumeMounts:
        - name: trust
          mountPath: /app/tls/ca
        - name: cert
          mountPath: /app/tls/client
        - name: pem
          mountPath: /app/tls/pem
      volumes:
      - name: trust
        secret:
          secretName: activemq-artemis-manager-ca
      - name: cert
        secret:
          secretName: messaging-client-cert
      - name: pem
        secret:
          secretName: cert-pemcfg
      restartPolicy: Never
---
apiVersion: batch/v1
kind: Job
metadata:
  name: consumer
  namespace: locked-down-broker
spec:
  template:
    spec:
      containers:
      - name: consumer
EOT
cat <<EOT >> deploy.yml
        image: quay.io/arkmq-org/activemq-artemis-broker-kubernetes:artemis.${BROKER_VERSION}
EOT
cat <<'EOT' >> deploy.yml
        command:
        - "/bin/sh"
        - "-c"
        - exec java -classpath /opt/amq/lib/*:/opt/amq/lib/extra/* org.apache.activemq.artemis.cli.Artemis consumer --protocol=AMQP --url 'amqps://artemis-broker-messaging-svc:61617?transport.trustStoreType=PEMCA&transport.trustStoreLocation=/app/tls/ca/ca.pem&transport.keyStoreType=PEMCFG&transport.keyStoreLocation=/app/tls/pem/tls.pemcfg' --message-count 10000 --destination queue://APP_JOBS --receive-timeout 30000;
        env:
        - name: JDK_JAVA_OPTIONS
          value: "-Djava.security.properties=/app/tls/pem/java.security"
        volumeMounts:
        - name: trust
          mountPath: /app/tls/ca
        - name: cert
          mountPath: /app/tls/client
        - name: pem
          mountPath: /app/tls/pem
      volumes:
      - name: trust
        secret:
          secretName: activemq-artemis-manager-ca
      - name: cert
        secret:
          secretName: messaging-client-cert
      - name: pem
        secret:
          secretName: cert-pemcfg
      restartPolicy: Never
EOT
kubectl apply -f deploy.yml
job.batch/producer created
job.batch/consumer created
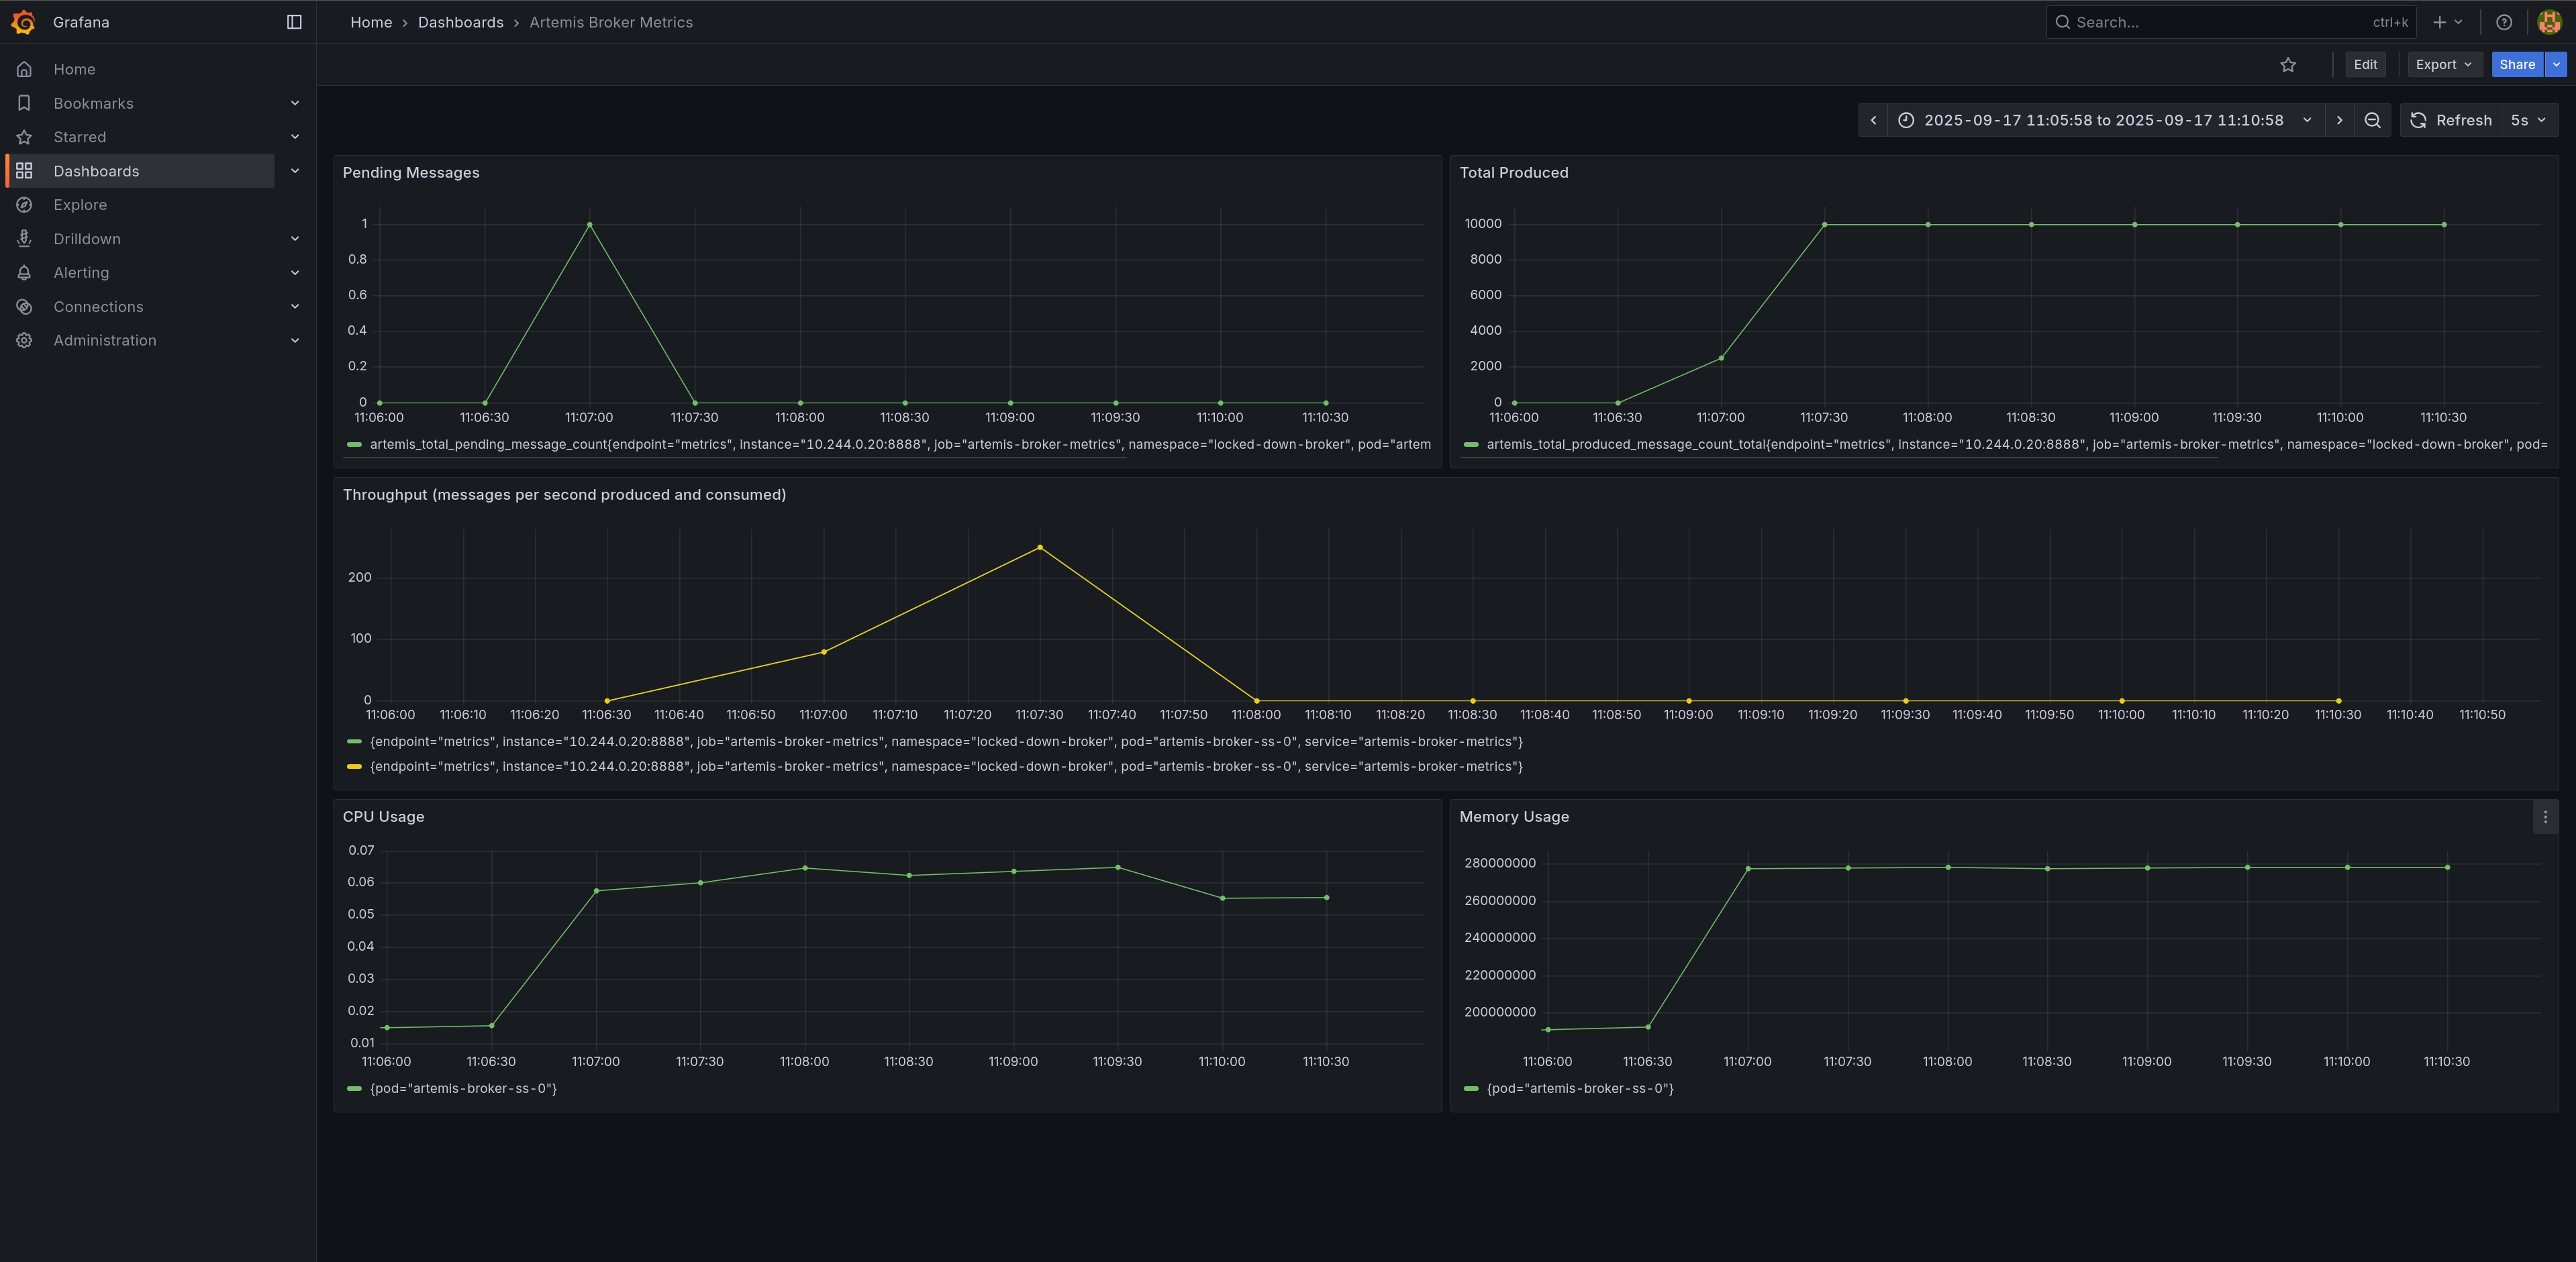
Observe the Dashboard
While the jobs are running, refresh your Grafana dashboard. You'll see:
- Pending Messages briefly spiking as the producer sends messages, then dropping to zero as the consumer catches up
- Total Produced and Total Consumed counters increasing
- Throughput panel showing messages per second rates (produced vs consumed)
- CPU Usage showing the broker pod's CPU consumption during message processing
- Memory Usage displaying the broker pod's memory footprint
Each panel is configured with an explicit datasource UID to prevent flickering:
- Broker metrics (Pending, Produced, Consumed, Throughput) →
artemis-prometheus(custom secured instance) - Infrastructure metrics (CPU, Memory) →
prometheus(default kube-prometheus-stack instance)
Note on CPU/Memory Queries: The queries use pod-level cAdvisor metrics (without container filters) because these metrics aggregate all containers in the pod. This provides a complete view of the broker's resource usage including the main container and any sidecars.
Wait for the jobs to complete.
kubectl wait job producer -n locked-down-broker --for=condition=Complete --timeout=240s
kubectl wait job consumer -n locked-down-broker --for=condition=Complete --timeout=240s
job.batch/producer condition met
job.batch/consumer condition met
Troubleshooting
This section covers common issues you might encounter and how to resolve them.
Certificate Issues
Problem: Certificates stuck in "Pending" or "False" state
# Check certificate status and events
kubectl describe certificate broker-cert -n locked-down-broker
kubectl get certificaterequests -n locked-down-broker
Solution: Verify cert-manager is running and check issuer configuration:
kubectl get pods -n cert-manager
kubectl describe clusterissuer ca-issuer
Problem: Certificate validation errors in broker logs
# Check broker logs for certificate errors
kubectl logs -l ActiveMQArtemis=artemis-broker -n locked-down-broker | grep -i cert
Solution: Ensure certificate DNS names match the broker FQDN and certificates are mounted correctly.
Prometheus Connection Issues
Problem: Prometheus shows broker target as "DOWN"
# Check ServiceMonitor configuration
kubectl describe servicemonitor artemis-broker-monitor -n locked-down-broker

# Verify service endpoints
kubectl get endpoints artemis-broker-metrics -n locked-down-broker
Solution: Verify the service selector matches broker pod labels and the metrics port (8888) is accessible:
# Test metrics endpoint directly from the broker pod
kubectl exec -n locked-down-broker artemis-broker-ss-0 -- curl -k https://localhost:8161/metrics

# Check if the custom Prometheus service is working
kubectl run test-prom --rm -i --restart=Never --image=curlimages/curl:latest -n locked-down-broker -- \
  curl -s http://artemis-prometheus-svc:9090/api/v1/targets | grep artemis
Problem: mTLS authentication failures
# Check if certificates are properly mounted in Prometheus
kubectl describe pod prometheus-artemis-prometheus-0 -n locked-down-broker
Solution: Ensure the ServiceMonitor references the correct certificate secrets and the CA bundle is valid.
Problem: Dashboard panels flickering or showing wrong data
# Check which Prometheus instances are running
kubectl get prometheus -n locked-down-broker

# Verify datasource URLs point to correct services
GRAFANA_PASSWORD=$(kubectl get secret -n locked-down-broker prometheus-grafana -o jsonpath="{.data.admin-password}" | base64 --decode)
kubectl exec -n locked-down-broker deployment/prometheus-grafana -- \
  curl -s http://localhost:3000/api/datasources -u admin:${GRAFANA_PASSWORD} | grep -E '"name"|"url"'
Solution: Ensure the artemis-prometheus datasource uses http://artemis-prometheus-svc:9090
(not prometheus-operated which load-balances between both Prometheus instances).
Broker Startup Issues
Problem: Broker pod fails to start or crashes
# Check pod status and events
kubectl describe pod -l ActiveMQArtemis=artemis-broker -n locked-down-broker

# View detailed logs
kubectl logs -l ActiveMQArtemis=artemis-broker -n locked-down-broker --previous
Common Solutions:
- Verify all required secrets are created and mounted
- Check JAAS configuration syntax
- Ensure broker properties are valid
- Verify sufficient resources are available
Messaging Client Issues
Problem: Producer/Consumer jobs fail with SSL/certificate errors
# Check job logs
kubectl logs job/producer -n locked-down-broker
kubectl logs job/consumer -n locked-down-broker
Solution: Verify the messaging client certificate and trust store configuration:
# Check if messaging certificates are ready
kubectl get certificate messaging-client-cert -n locked-down-broker
kubectl describe secret messaging-client-cert -n locked-down-broker
Grafana Access Issues
Problem: Cannot access Grafana dashboard
# Check Grafana pod status
kubectl get pods -l app.kubernetes.io/name=grafana -n locked-down-broker

# Verify ingress configuration
kubectl describe ingress grafana-ingress -n locked-down-broker
Solution: Ensure ingress controller is running and DNS resolution works:
# Test ingress controller
kubectl get pods -n ingress-nginx

# Check if hostname resolves
nslookup grafana.locked-down-broker.$(minikube ip --profile tutorialtester).nip.io
Grafana Panels Show No Data or Flicker:
-
Check Datasources: Go to Configuration → Data Sources and verify:
Artemis-Prometheusexists with URLhttp://prometheus-operated:9090Prometheusexists with URL pointing to kube-prometheus-stack- Both show green "Data source is working" when tested
-
Test Queries Directly in Grafana's Explore view:
-
Switch to
Artemis-Prometheusdatasource -
Query:
artemis_total_pending_message_count -
Should return data if broker is scraping correctly
-
Switch to
Prometheusdatasource -
Query:
container_cpu_usage_seconds_total -
Should return data if kubelet metrics are available
-
-
Check Panel Settings: Edit a panel and verify:
- Datasource is explicitly set (not using "default")
- Query datasource also matches panel datasource
-
Force Dashboard Reload:
- Click the dashboard settings (gear icon) → JSON Model
- Copy the JSON, delete the dashboard, recreate it by pasting the JSON
General Debugging Commands
# View all resources in the namespace
kubectl get all -n locked-down-broker

# Check resource usage
kubectl top pods -n locked-down-broker

# View cluster events
kubectl get events -n locked-down-broker --sort-by='.lastTimestamp'

# Export configurations for analysis
kubectl get activemqartemis artemis-broker -n locked-down-broker -o yaml
kubectl get prometheus artemis-prometheus -n locked-down-broker -o yaml
Cleanup
To leave a pristine environment after executing this tutorial, delete the minikube cluster.
minikube delete --profile tutorialtester
* Deleting "tutorialtester" in kvm2 ...
* Removed all traces of the "tutorialtester" cluster.
Conclusion
This tutorial demonstrated how to deploy a production-ready, security-first Apache ActiveMQ Artemis broker with comprehensive monitoring on Kubernetes. You now understand how to:
- Implement Zero-Trust Messaging: All broker communication requires mutual TLS authentication using certificates issued by a managed PKI.
- Automate Certificate Management: Use
cert-managerandtrust-managerto handle certificate lifecycle and distribution across namespaces. - Monitor Securely: Configure Prometheus to scrape metrics using the same certificate-based authentication that protects the broker.
- Visualize in Real-Time: Set up Grafana dashboards to observe messaging patterns, throughput, and broker health.
Key Security Concepts:
- Certificate-based role assignment (CN determines broker permissions)
- Locked-down brokers (
spec.restricted: true) disable anonymous access - ServiceMonitor resources enable secure metrics collection
- Separate certificates for different components (operator, Prometheus, clients)
Monitoring Architecture:
- Dual Prometheus Setup: One instance for cluster metrics (CPU/Memory), one for broker metrics (messages/throughput)
- Dedicated Services:
artemis-prometheus-svcprevents load-balancing issues between Prometheus instances - Explicit Datasource References: Dashboard panels specify datasource UIDs to eliminate flickering
- Comprehensive Dashboards: Real-time visualization of both infrastructure and application metrics
This approach is suitable for production environments where security compliance and observability are essential. The certificate management foundation and monitoring architecture you've built can be extended to secure and monitor additional components in your messaging infrastructure.
Production Considerations
When deploying this configuration in production:
- Certificate Management: Integrate with your organization's existing PKI or use external certificate providers like Let's Encrypt with DNS challenges
- High Availability: Deploy multiple broker instances with clustering and persistent storage
- Monitoring: Set up alerting rules in Prometheus for broker health, certificate expiration, and performance metrics
- Security: Implement network policies, pod security policies, and regular security scans
- Backup: Ensure regular backups of persistent volumes and certificate data
- Performance: Monitor resource usage and scale components based on actual load patterns